Market overview
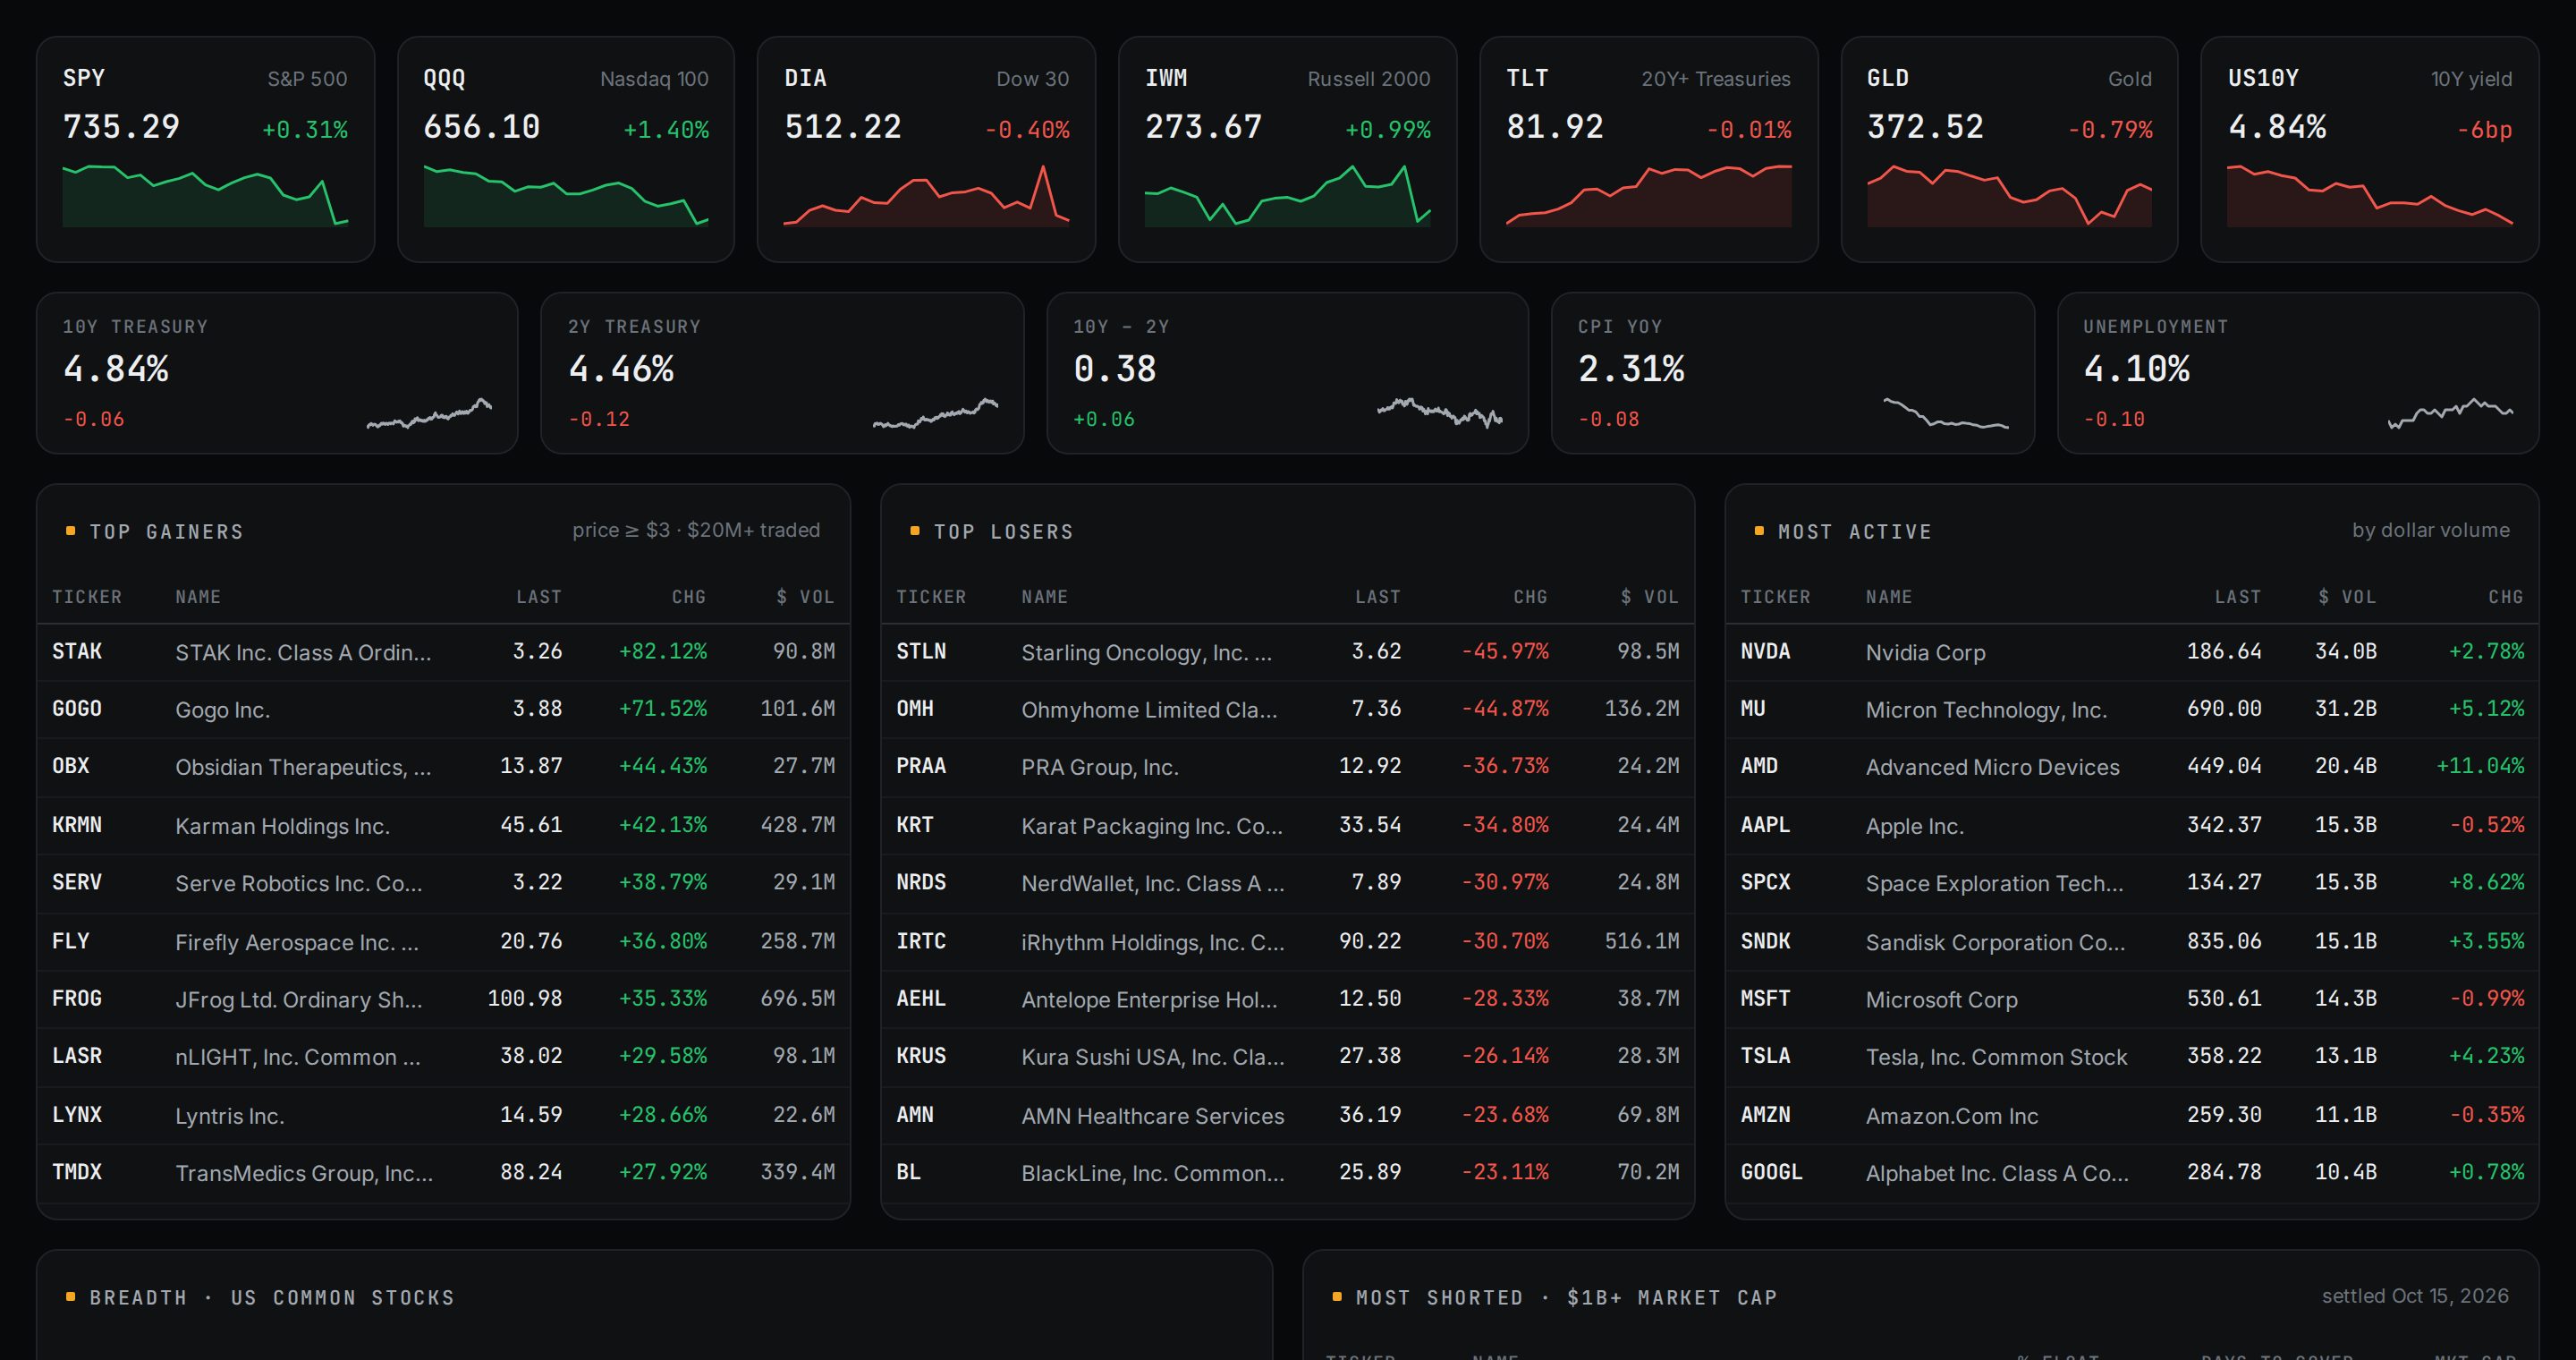
Indices, rates, gainers and losers, breadth and the most-shorted names, as of the latest close.
Alpha Desk puts market data, company fundamentals, portfolio tracking, return attribution and Fama-French factor models in one fast terminal, built on our own data warehouse.
Each tab answers a question you'd otherwise need a spreadsheet for.
Indices, rates, gainers and losers, breadth and the most-shorted names, as of the latest close.
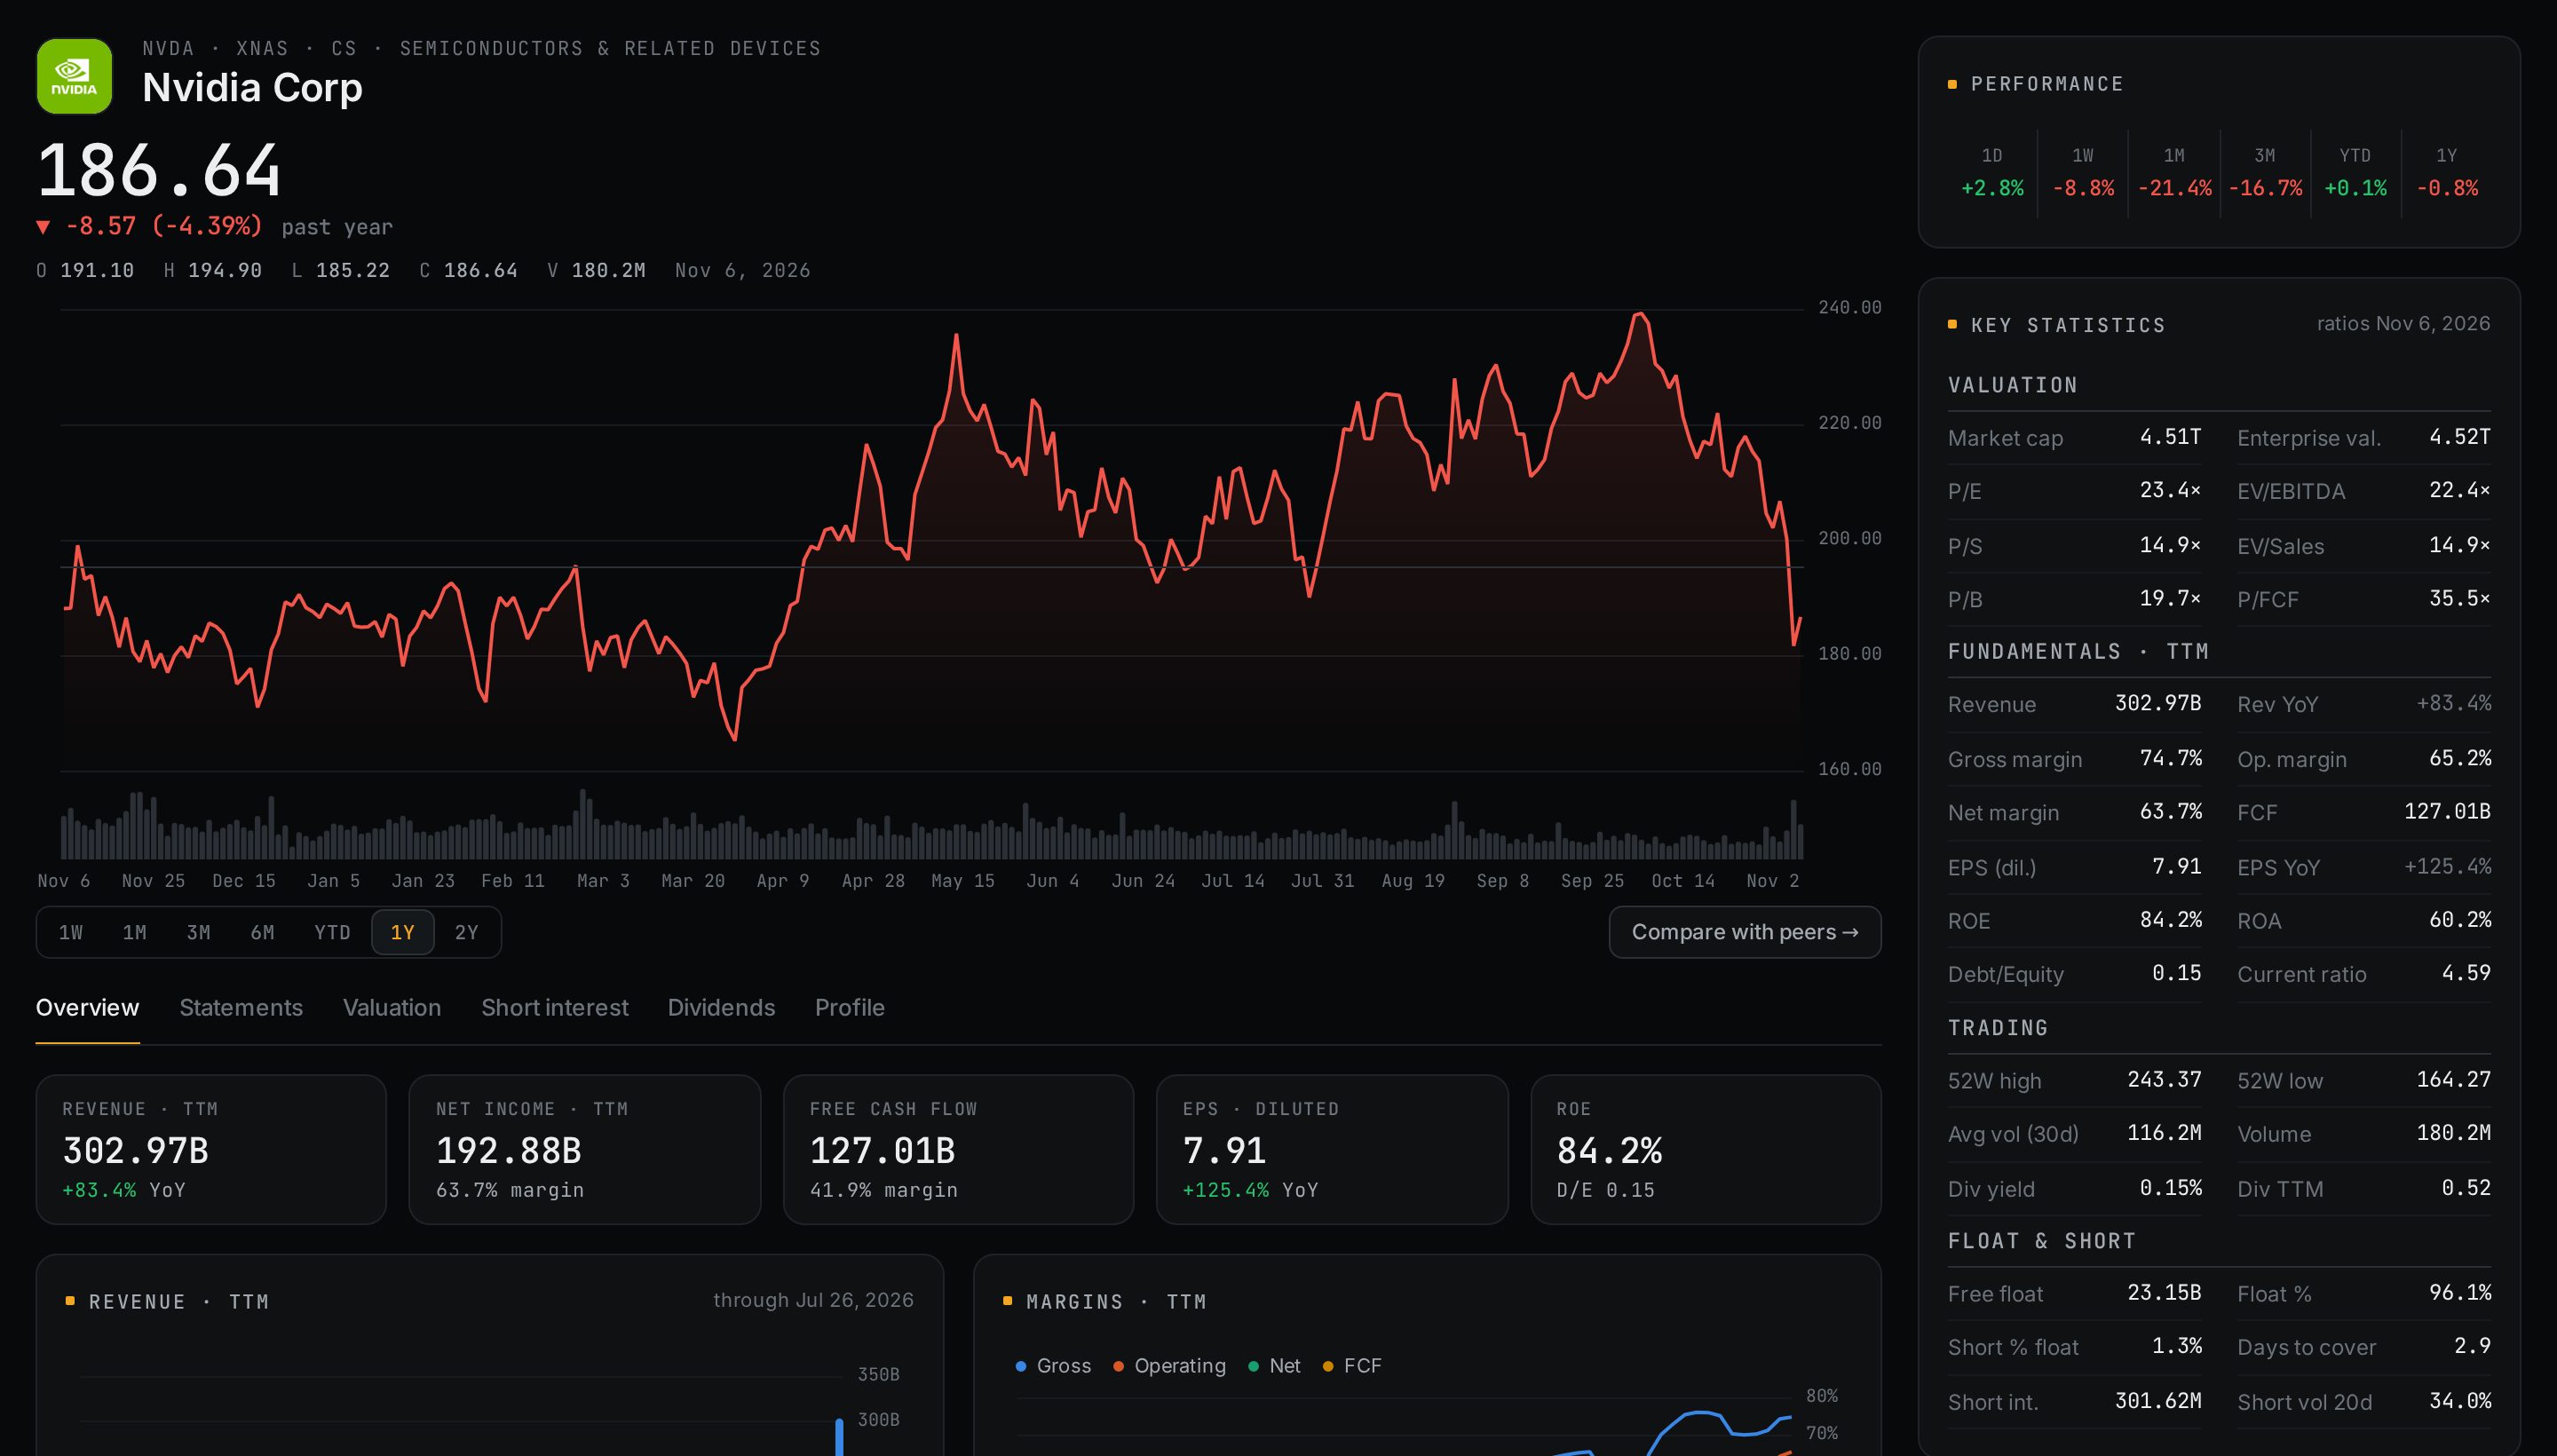
Price and volume, trailing-twelve-month fundamentals, valuation history, short interest, dividends and splits.
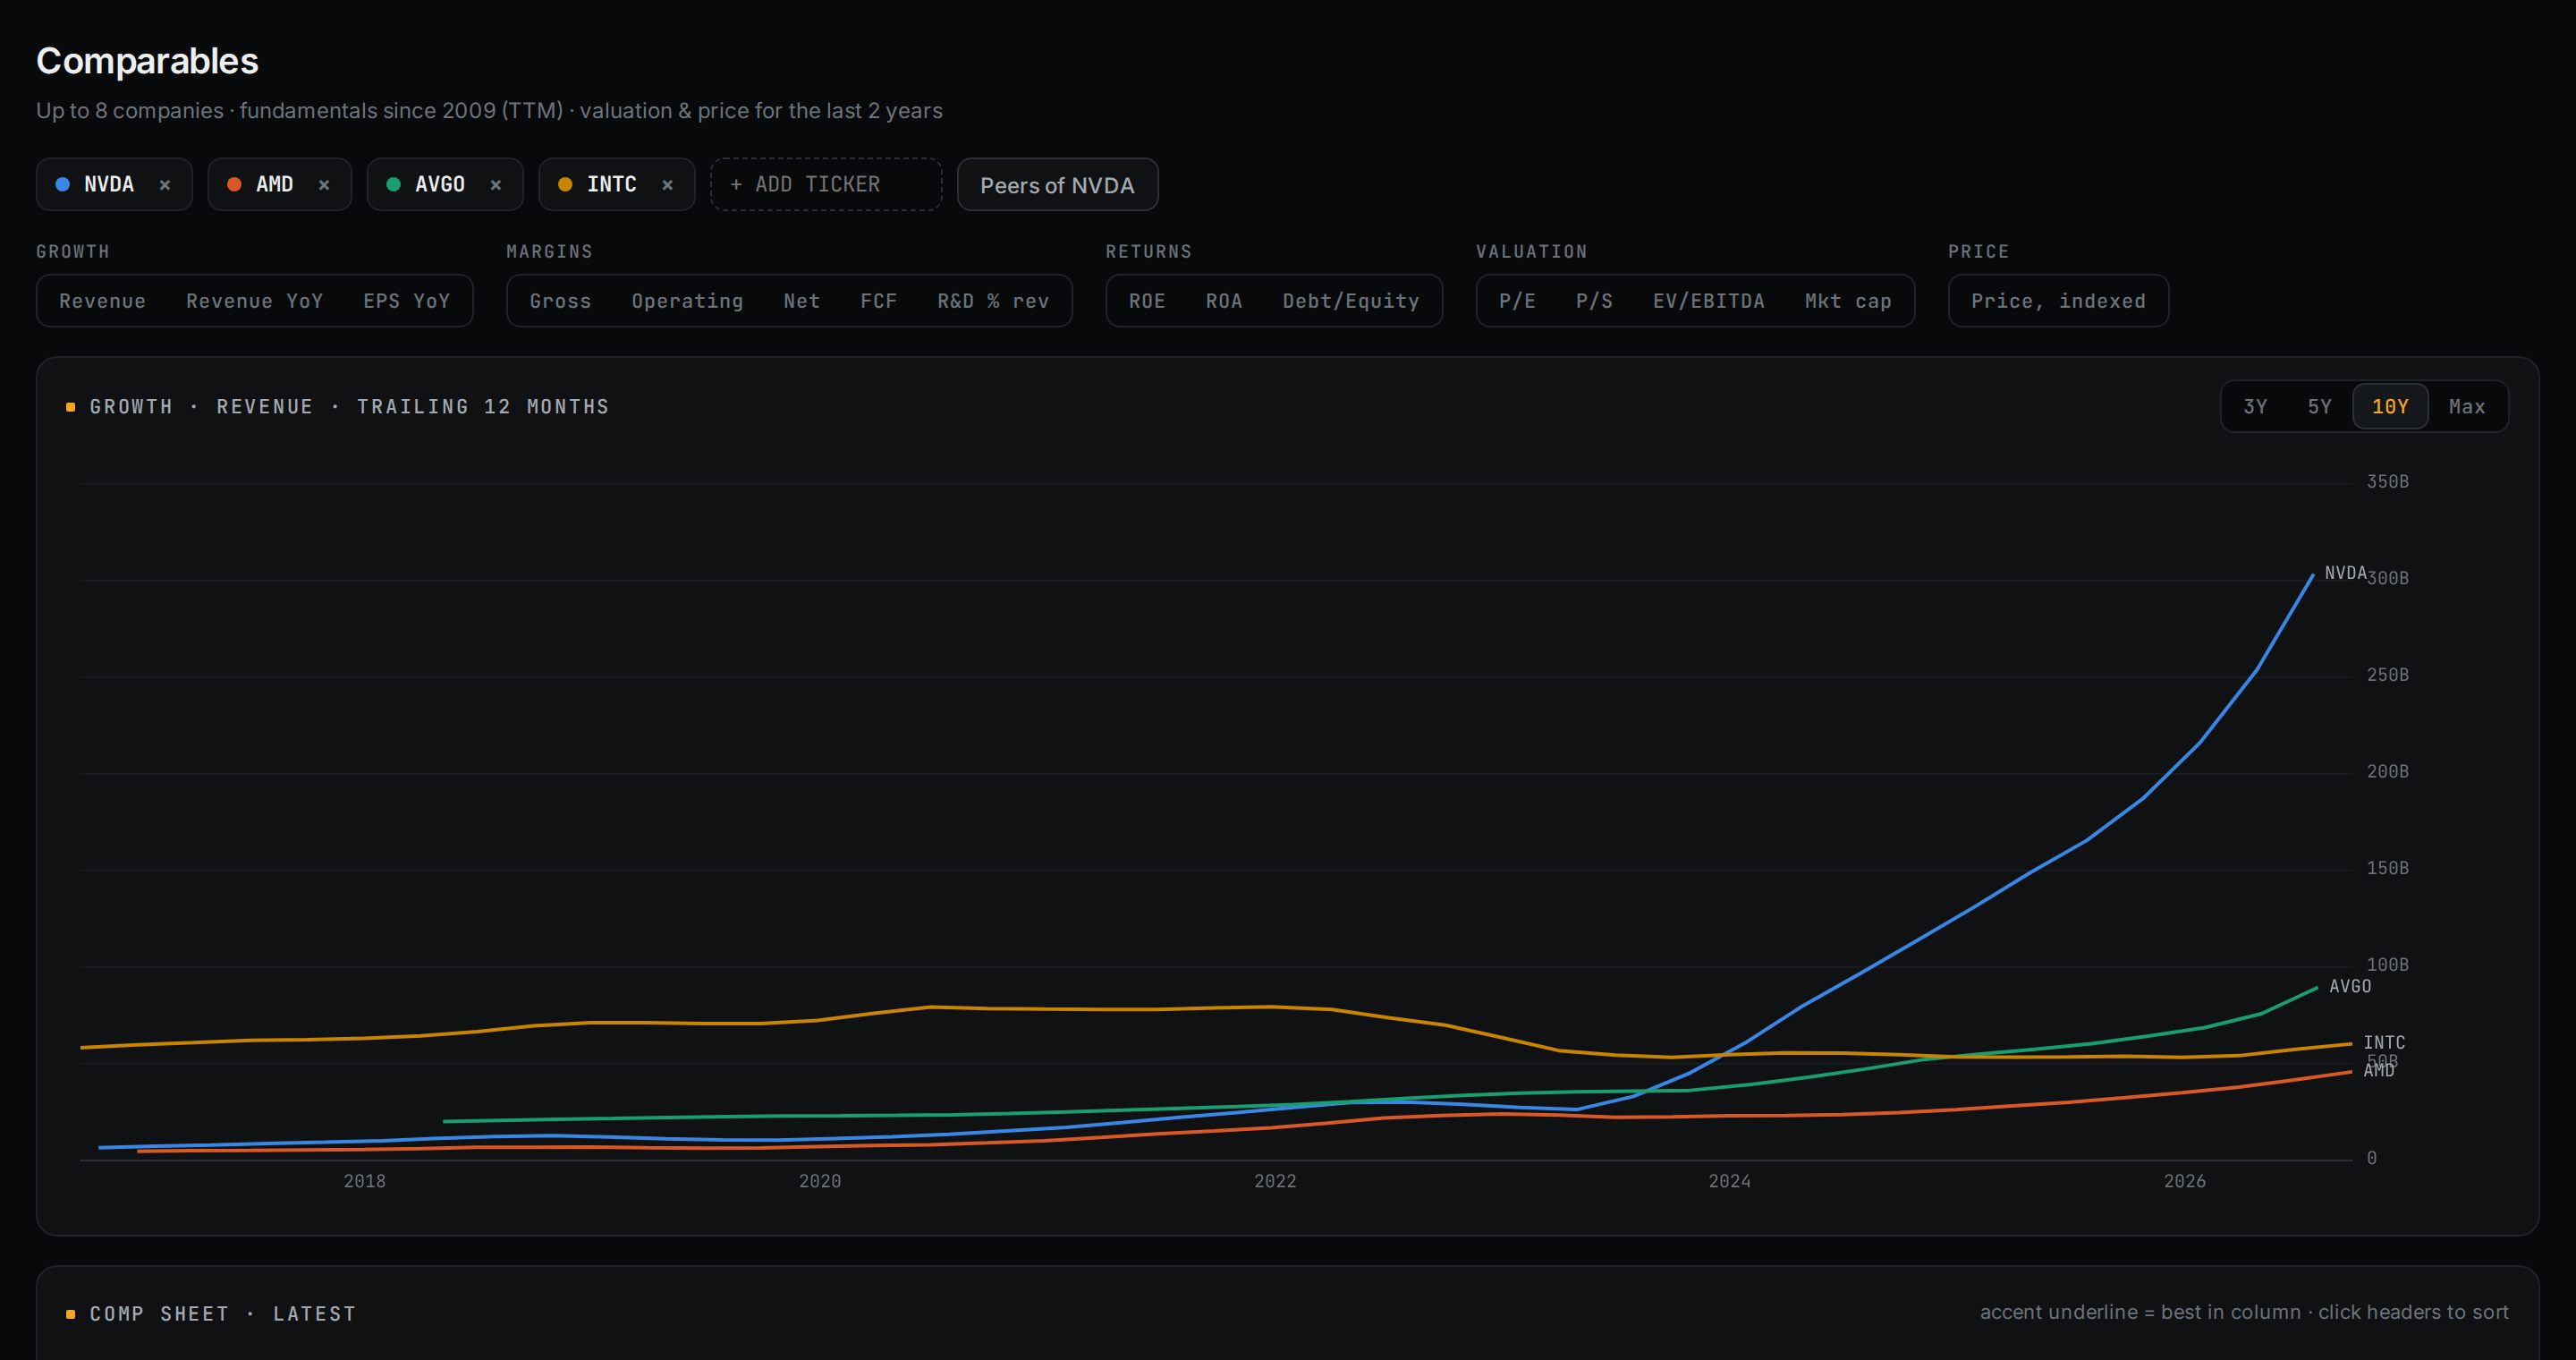
Line up to eight companies on growth, margins, returns and valuation through history.
Treasury curve, inflation and jobs, plus a sortable screen of the whole US market.
Trades, cash and dividends, with positions and realised and unrealised P&L adjusted for splits.
Brinson-Fachler allocation, selection and interaction against any of 47 benchmarks, holding by holding and sector by sector.
Indices, Treasury yields and key macro prints, then the day's biggest moves filtered for liquidity, so penny stocks don't crowd the list.
Revenue growth, margins, ROE, P/E and more for up to eight companies, with a comp sheet that highlights the best in each column.
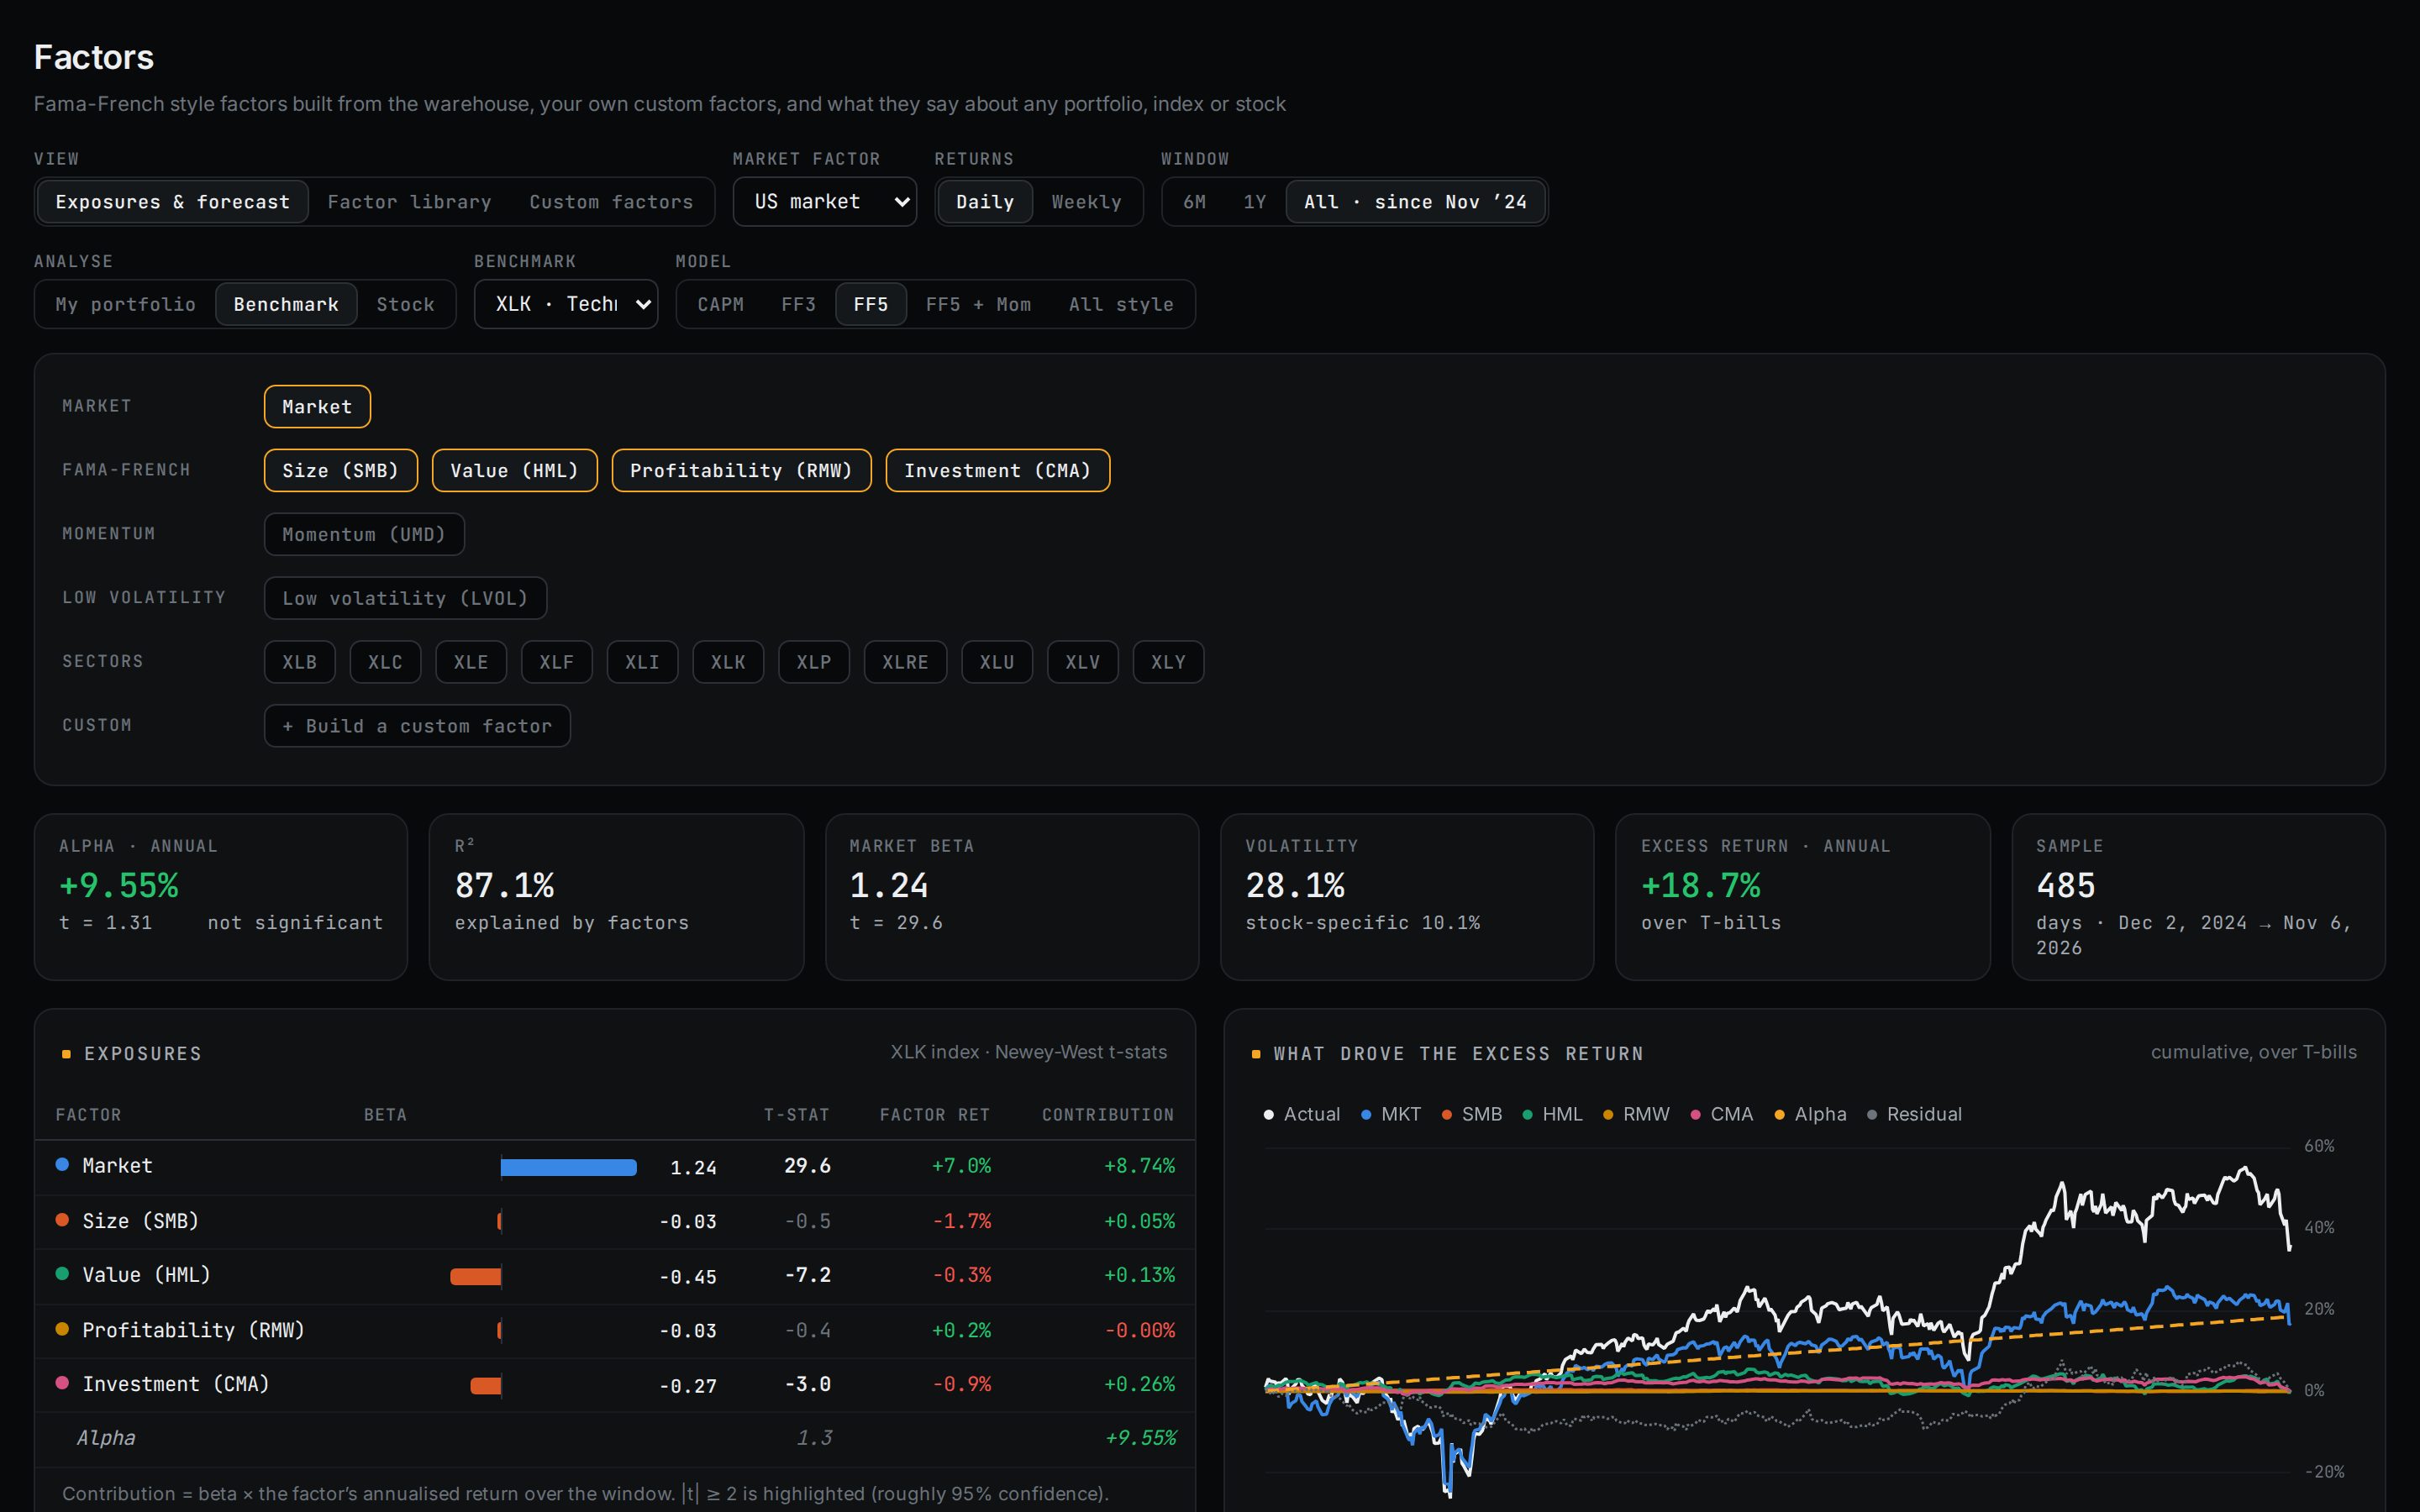
Size, value, profitability, investment, momentum, low-volatility and sector factors, built in-house the Fama-French way. Regress your portfolio, any benchmark or any stock on them, with Newey-West t-stats, rolling betas and a breakdown of what drove the excess return.
Build your own factors from a basket of stocks or a benchmark, then use them in the same analysis.
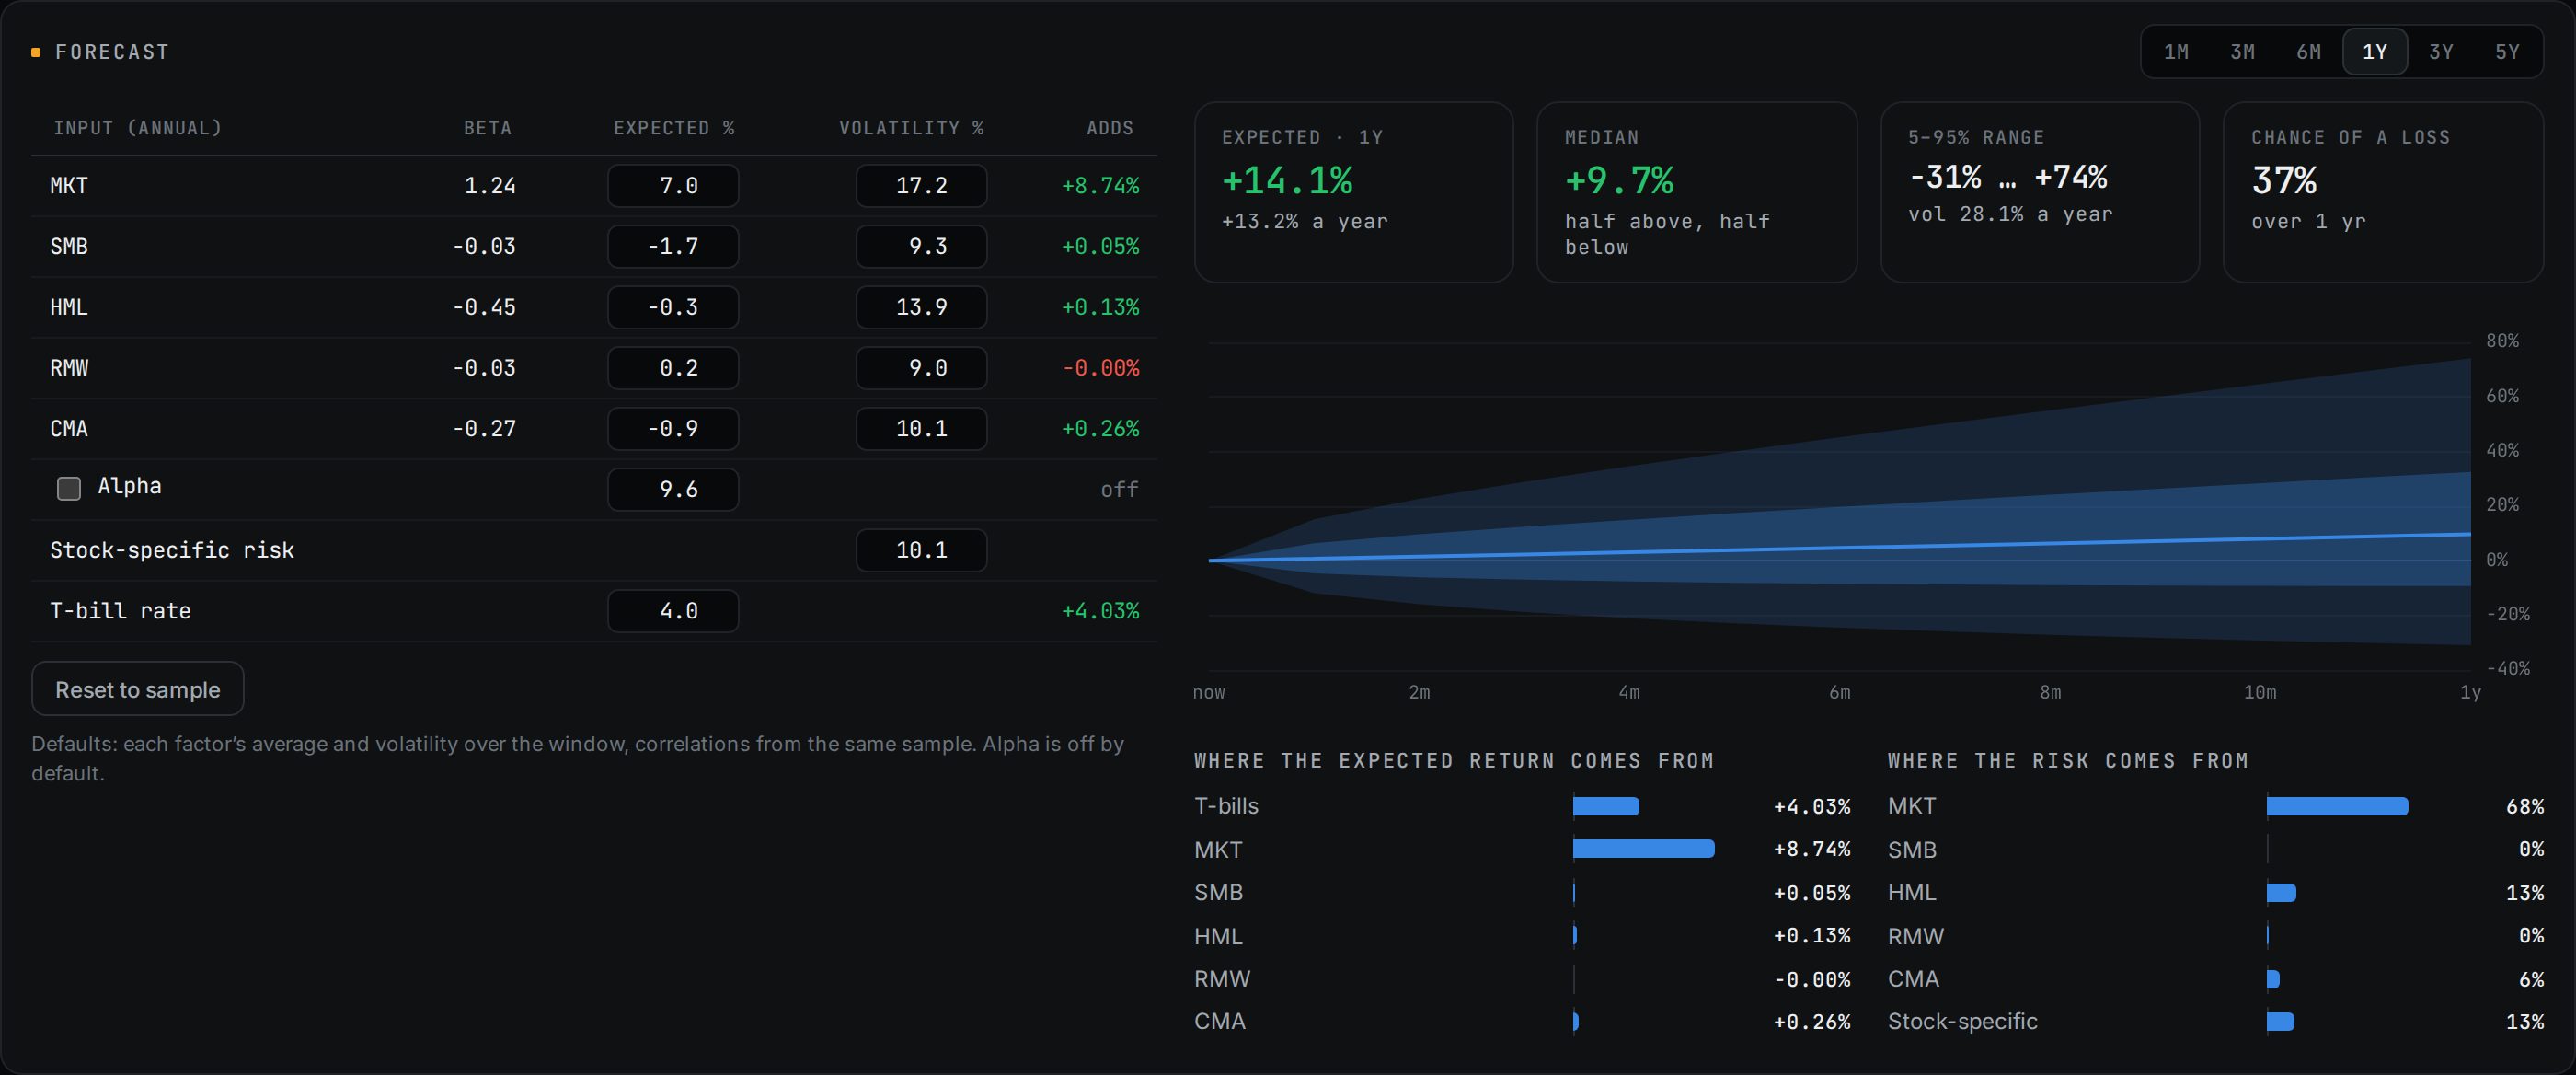
Start from the sample averages or type in your own factor forecasts. Alpha Desk turns them into an expected return, a 5–95% range, the chance of a loss and a fan chart, and shows where the return and the risk come from.
Accounts are by invitation. Sign in with a one-time code sent to your approved email; there are no passwords to leak.
Each account's trades and custom factors are separate, and personal data is never cached on shared servers.
Every request passes through Cloudflare's login and rate limits before it reaches our servers.
Don't have access yet? Ask the person who runs Alpha Desk to add your email.